The Development Journey of the Cycling Life - SAS Admin Panel Web

As more people opt for eco-friendly transportation like bicycles, a problem arises: there aren’t enough repair centers to maintain them. Without timely repairs, our sustainability efforts could suffer. It’s crucial to address this issue swiftly to keep advancing toward our environmental goals.
UI UX case study for SAS admin panel web application by Harshana Gamage
Jönköping, Sweden
Where
Web application (Admin panel)
What
Manage bicycle service business
Why
UI/UX Designer, researcher Role
On Demand, Service, E-commerce
Category
Nov 2023 – Dec 2023
When

What is this project?

This project is designed to provide a centralized management web-based system for bicycle service providers. It is an admin panel web application, and users can manage their business through this application. Some of the features include managing branches, products, online orders, and service bookings. This is one part of a major project, which includes a customer mobile app, a service provider’s mobile app, and the admin panel web application. In this case study, I describe how and what I did to develop this “Cycling Life – SAS Admin Panel Web” project.

Market research​

I conducted a brief research to assess the current landscape of bicycle riders in Sweden, specifically focusing on the options available to them. The aim was to gauge satisfaction with existing services and identify potential gaps or needs within the market. In particular, the study delved into the preferences of cyclists in Jonkoping city to determine if there is demand for our newly introduced features. This research will provide valuable insights into the viability and potential success of our innovative offerings tailored to the specific needs of the cycling community in Jonkoping.

Market overview

The analysis indicates a gradual decline in bicycle unit sales from 2016 to 2024. However, projections suggest a notable increase in unit sales by 2028. This anticipated growth is attributed to Europe’s strong commitment to sustainability solutions, particularly the promotion of bicycles in European countries, with a specific focus on Sweden. The trend underscores a promising market shift towards more eco-friendly transportation options.

Bicycles have been a popular mode of transport since 1817, with approximately 143 million units sold worldwide in 2022. Asia led in sales, notably China with 43 million units, followed by Europe at 24 million, mainly in Germany and France, and North America with 22 million, predominantly in the United States.

Sales have steadily grown over the past decade, influenced by a global pursuit of healthier lifestyles and a preference for eco-friendly transportation amid climate change concerns. The COVID-19 pandemic further boosted sales in 2020 and 2021, with a slight decrease in 2022 compared to the peak pandemic years.

Despite this, the market is expected to maintain its long-term growth trend. However, rising standards of living may pose a risk as increased income might lead to a shift towards more expensive and convenient alternatives. Overall, the bicycle market remains resilient, driven by health consciousness, environmental concerns, and recent pandemic-induced demand.

Revenue analyzing overview

Based on my research, revenue has shown a steady increase since 2016 and is projected to reach 530 million USD by 2028.

One of the mindfulness facts and statistics worth considering in the US region is that, although everyone is practicing meditation weekly, individuals aged 65 and above are devoting more time. Specifically, 19% of those aged 18-29 practice meditation, 28% of individuals aged 30-49 engage in meditation, and a noteworthy 53% of those aged 65 and older practice meditation.

Analyze the demand on the world

Below map displaying searches for “mindfulness” among different countries. Darken shade of color translates to higher volume of searches for a specific country.

Analyze the demand on the world

The growing demand for bicycles and related services has led to a significant increase in prices, indicating a robust market for this business model. Prices have surged from USD 500 in 2015 to USD 1,650 in 2023, with an anticipated rise to USD 1,850 by 2028, presenting opportunities for new entrants in the market.

Global revenue comparison based on bicycle & services

Top 5 countries in 2023 (Million USD)

1. China
2. Germany
3. United State
4. India
5. France 

$10,400
$8,702
$8,610
$2,971
$2,784

Bicycles Market Overview.

2024 Projected Revenue: US$69.23 billion
Annual Growth Rate: 1.62%
Projected 2028 Market Volume: US$73.82 billion
2028 Expected Unit Sales: 138.30 million bicycles
2024 Volume-Weighted Average Price: US$0.49k
International Revenue Leader (2024): China – US$10,520 million

Competitive analysis

During the competitive analysis phase, I examined various mobile apps and websites associated with online bicycle stores and service providers. The focus was on identifying platforms that offer comprehensive services and gauging customer satisfaction. The goal was to pinpoint any existing gaps that my solution could potentially address.
competitor 1 for my case study
01. Rentbike.se
Rentbike is basically doing bike renting out and bike reparing service. They do not sell bikes or bike parts as an ecommerce website.
competitor 2 for my case study
02. Bike24
Bike24 is a bicycle part selling online ecommerce website. They do not provide services or bicycle renting options.
competitor 3 for my case study
03. Bicycle warehouse
Bicycle Warehouse is also a bicycle parts selling online ecommerce platform. Apart from that they provide bicycle repairing services.

Analyzing features of competitor apps

Problems found from customers’ reviews and comments

User survey

To obtain additional details from actual customers, I conducted a small survey in the Facebook group “Cykelstaden Jönköping,” which actively involves more than 1,500 cyclists in Jonkoping city. All the members in this group are cyclists, and the results obtained from them regarding their frustrations, desires, preferences, and needs were very fruitful.

Facebook group survey 👍🏻

What

I collected data from the Facebook group. Created few posts and a Google survey form to share in the Facebook group.

How

Share posts and the survey form link in the group and invited to group members to participate to this to share their ideas.

Results

This survey was highly successful, with approximately 700 members actively participating and filling out the online survey. A significant number of participants also expressed their appreciation through personal messages, acknowledging the effort made to gather their thoughts and design a platform tailored to their preferences and needs.

This is a survey question; candidates can select YES, NO, or May be.

girl show the research

My research indicates

My research shows that a significant portion of cyclists are willing to spend more money to have their bicycles repaired and receive regular bicycle services at their own home on demand. They believe that cyclists form a community, much like a family, and they express enthusiasm for a dedicated community platform rather than using a Facebook group.

Its time to start the designing!

After analyzing my research data and feedback received from the Facebook group members, I began mapping out the entire project flow, including the Customer mobile app, Service provider mobile app, and the Admin Panel web application. In this phase, I focused specifically on the design of the Admin Panel web application. I finalized the initial flows and created some low-fidelity wireframes.

Flow diagram

I covered all the essential and main features of the admin panel web application in this flow diagram. I only showed success statuses, highlighting only a few instances of failed status to make the flow chart much clearer.

Admin user flow

Low-fidelity wireframes

After finishing & reviewing the entire flow diagram of the project (only admin panel web application related features are displayed in this document), I started drawing low-fidelity wireframes for the admin panel.

"Cycling Life" design system

As usual, I started by selecting the color palette for the web application and the font style. Then, I began creating the main components of the web application.

Colors used for the design

Branding and logo concept

Logo design for the "Cycling Life"

The idea of the project is to provide an easy-access solution for cyclists. This concept should be reflected in the logo, symbolizing the ease of access for cyclists. I thought about a simple logo idea that shows a person on a bicycle. This visual representation suggests that with our service, you can always enjoy your ride, as we take care of all your troubles. I initially sketched the logo concept with a pencil and white paper, and later, I designed the digital version. 

I created a few variations, including matching logos for both dark and white backgrounds.

Other icons created for the web application

I created icons to be used as buttons in the web application, including a bicycle icon and a bicycle type icon.

Typography

For this project, I utilized the ‘Inter‘ font, opting for a simple style. I used various font weights, including regular, medium, bold, and extra bold, and used font sizes ranging from 12pt to 30pt.

Inter

Aa Ba Cc Dd Ee Ff Gg Hh Ii Jj Kk Ll

0 1 2 3 4 5 6 7 8 9

Components designed for the project

Buttons

Buttons are integral components of any app. I carefully designed them with matching colors. Moreover, I ensured that the buttons are easy to press, with the correct width and height, aligning seamlessly with watchOS interfaces to facilitate easy interaction with finger presses.

List and cards

Graphs, progress bars, and indicators

High Fidelity UI of Admin panel web application.

I have designed a total of 23 high-fidelity designs for this admin panel web application project! I tried a few different designs for the selected menu button in the main menu. I have also designed a minimized version of the main menu, which allows an increase in the size of the main content area.

Dashboard screen

This is the main screen the admin is redirected to when logged in to the web application. This screen shows the overall status of the business, allowing the admin user to get an instant idea of the current business status. Some of the information shown here includes a sales summary in a graph, the latest online orders and service booking records, currently operational drivers and service providers, upcoming service reminder, tracking drivers on the map, expense summary, profit summary, etc.

Online order screen

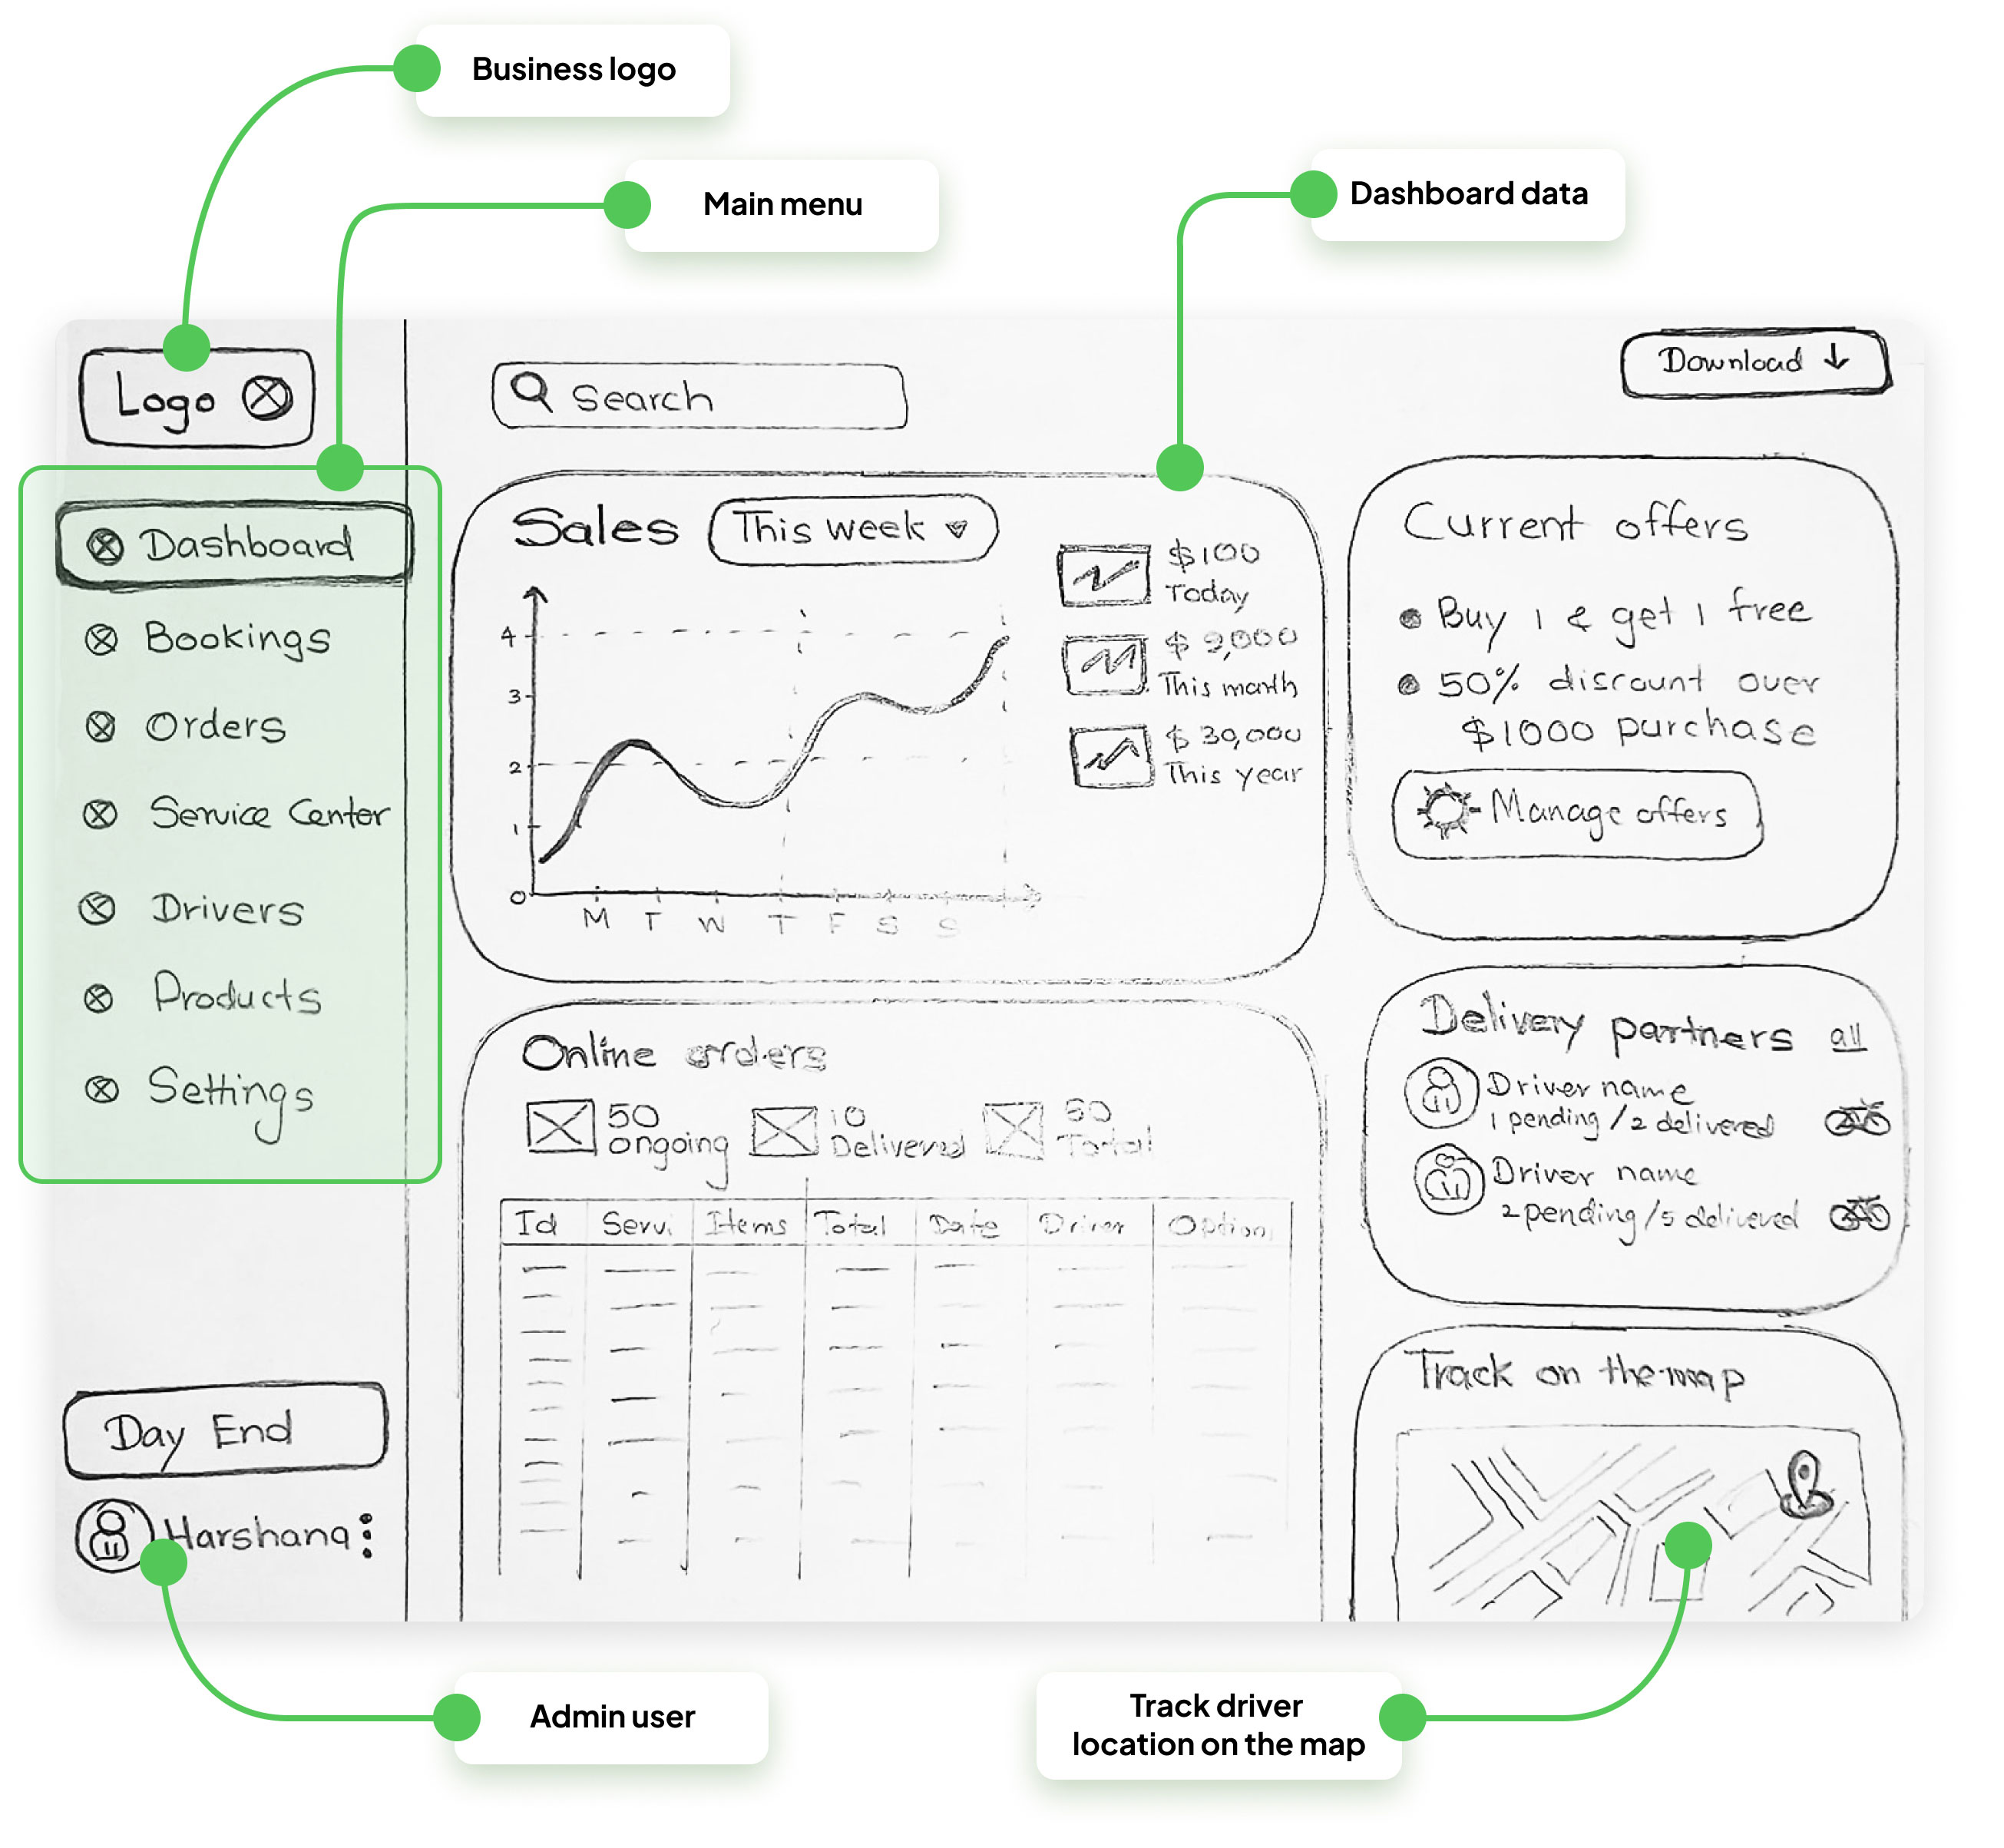
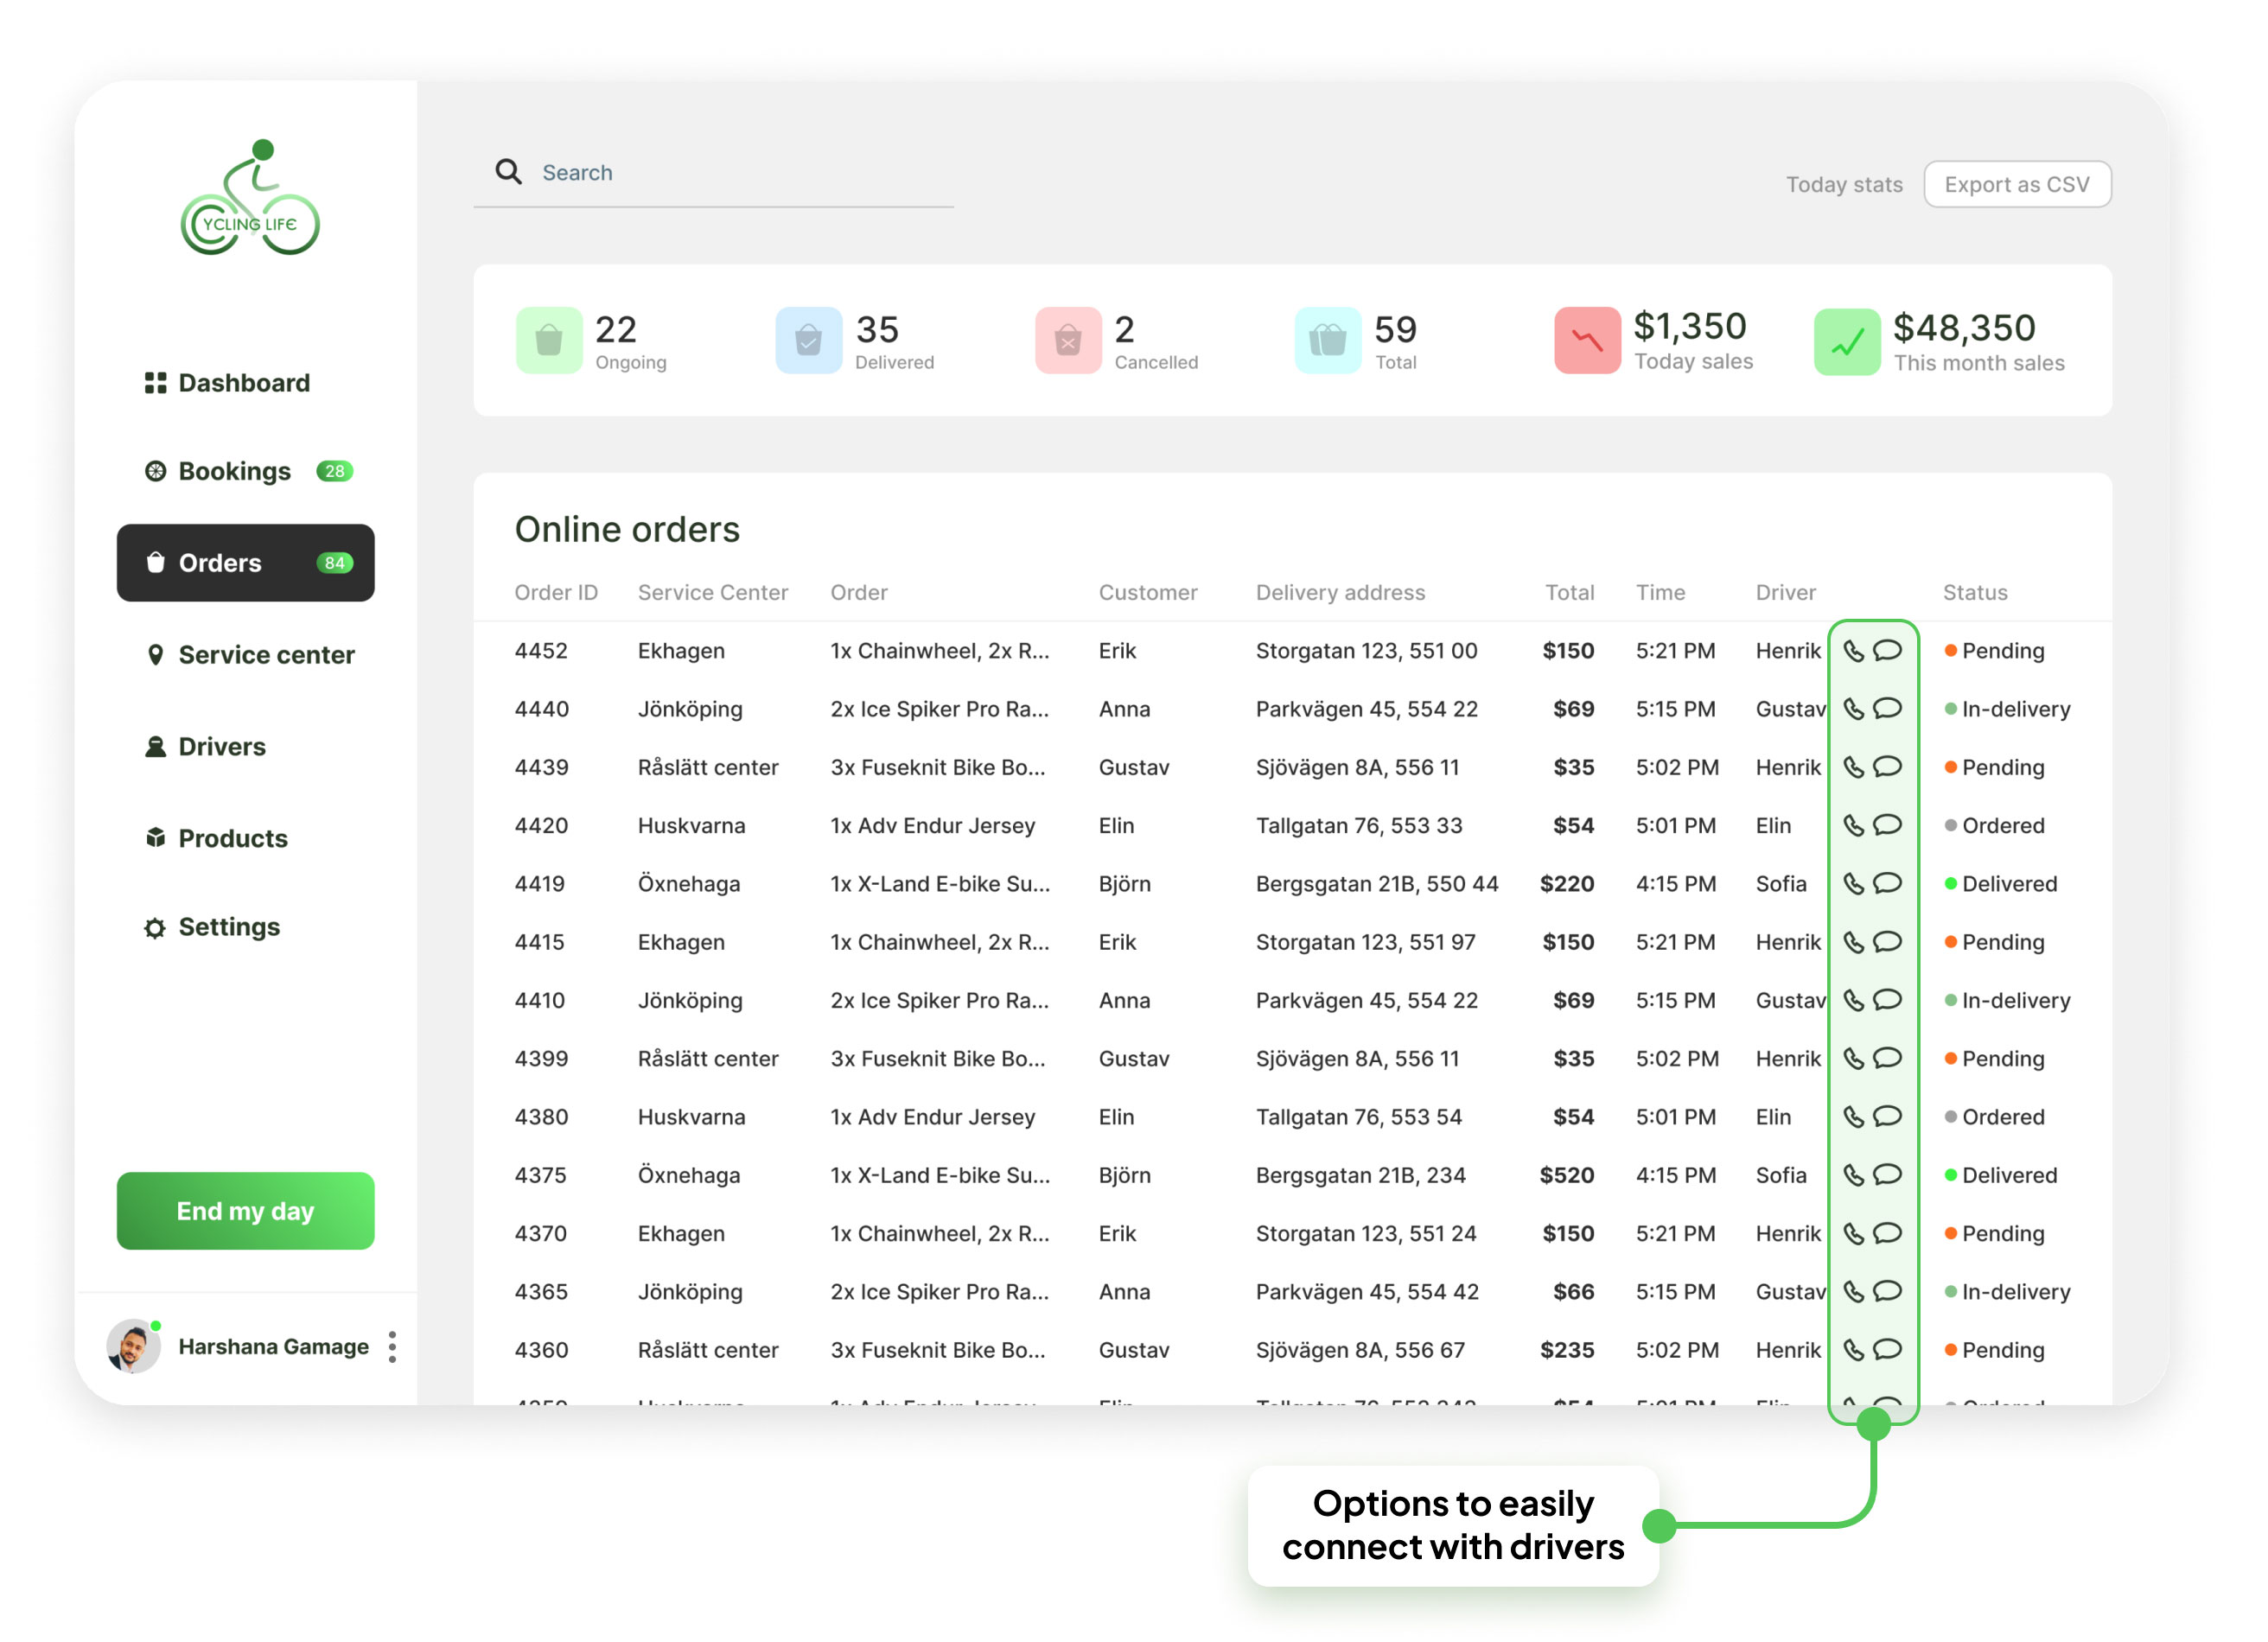
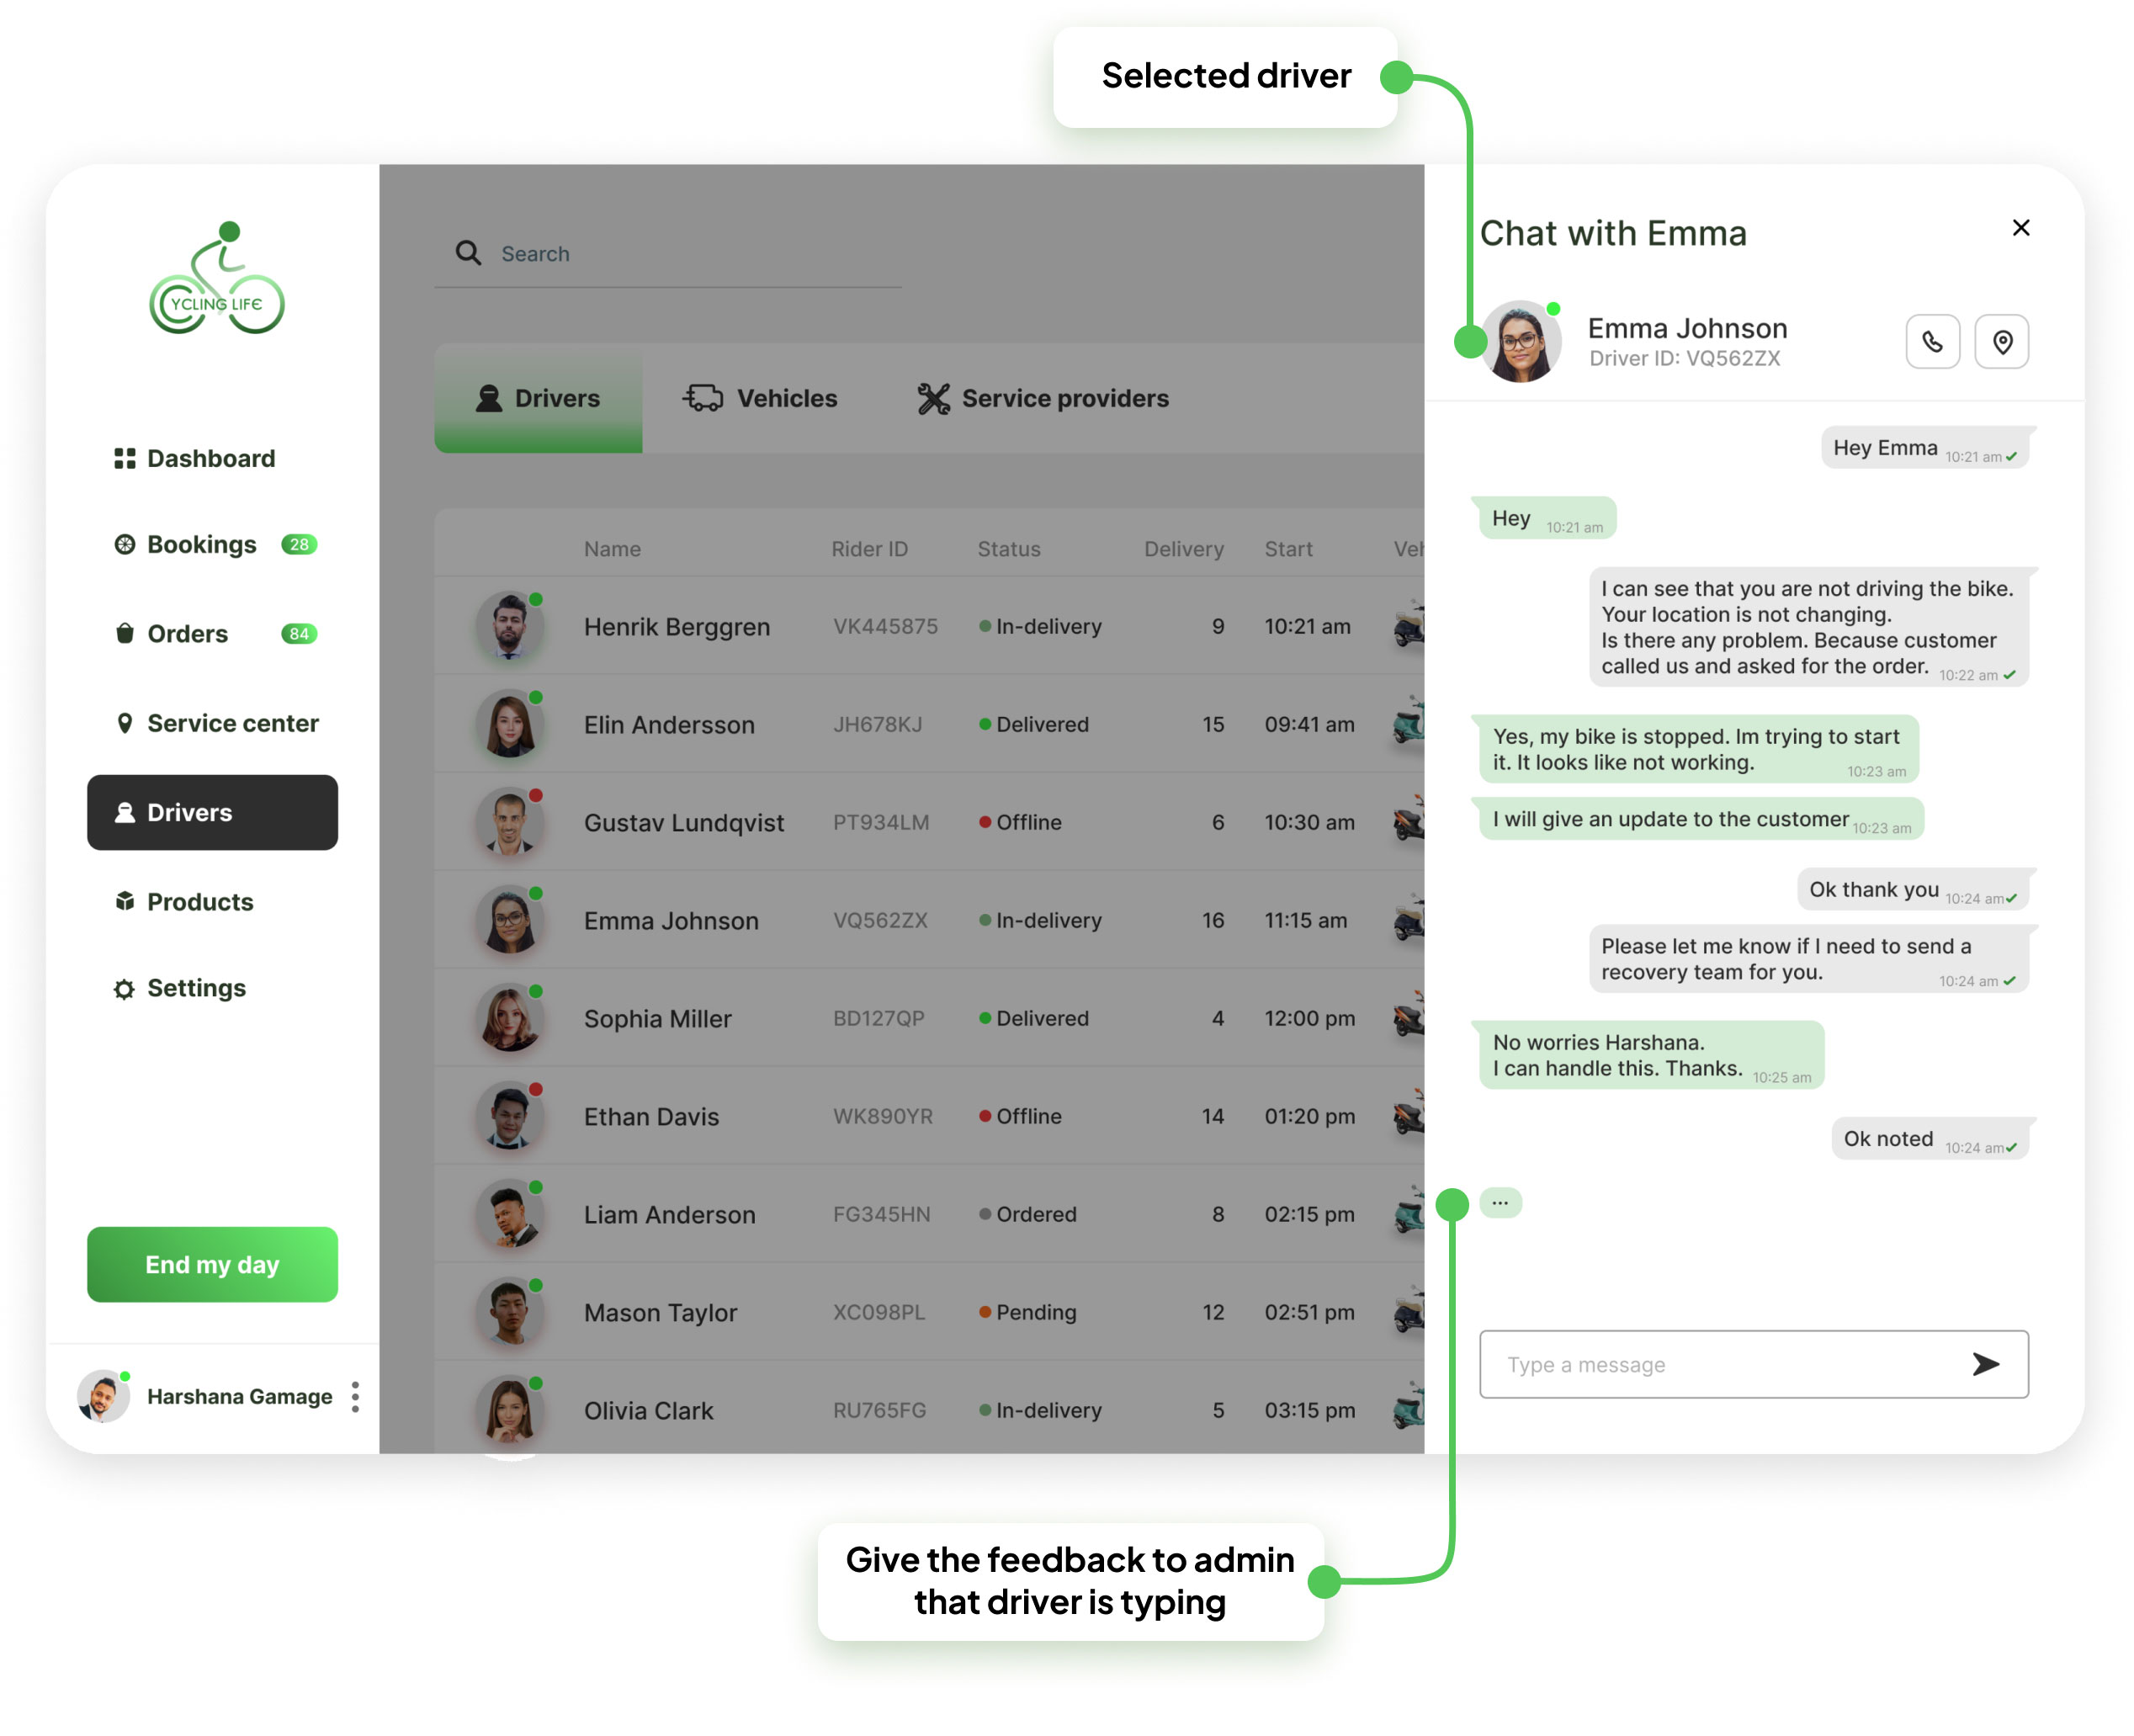
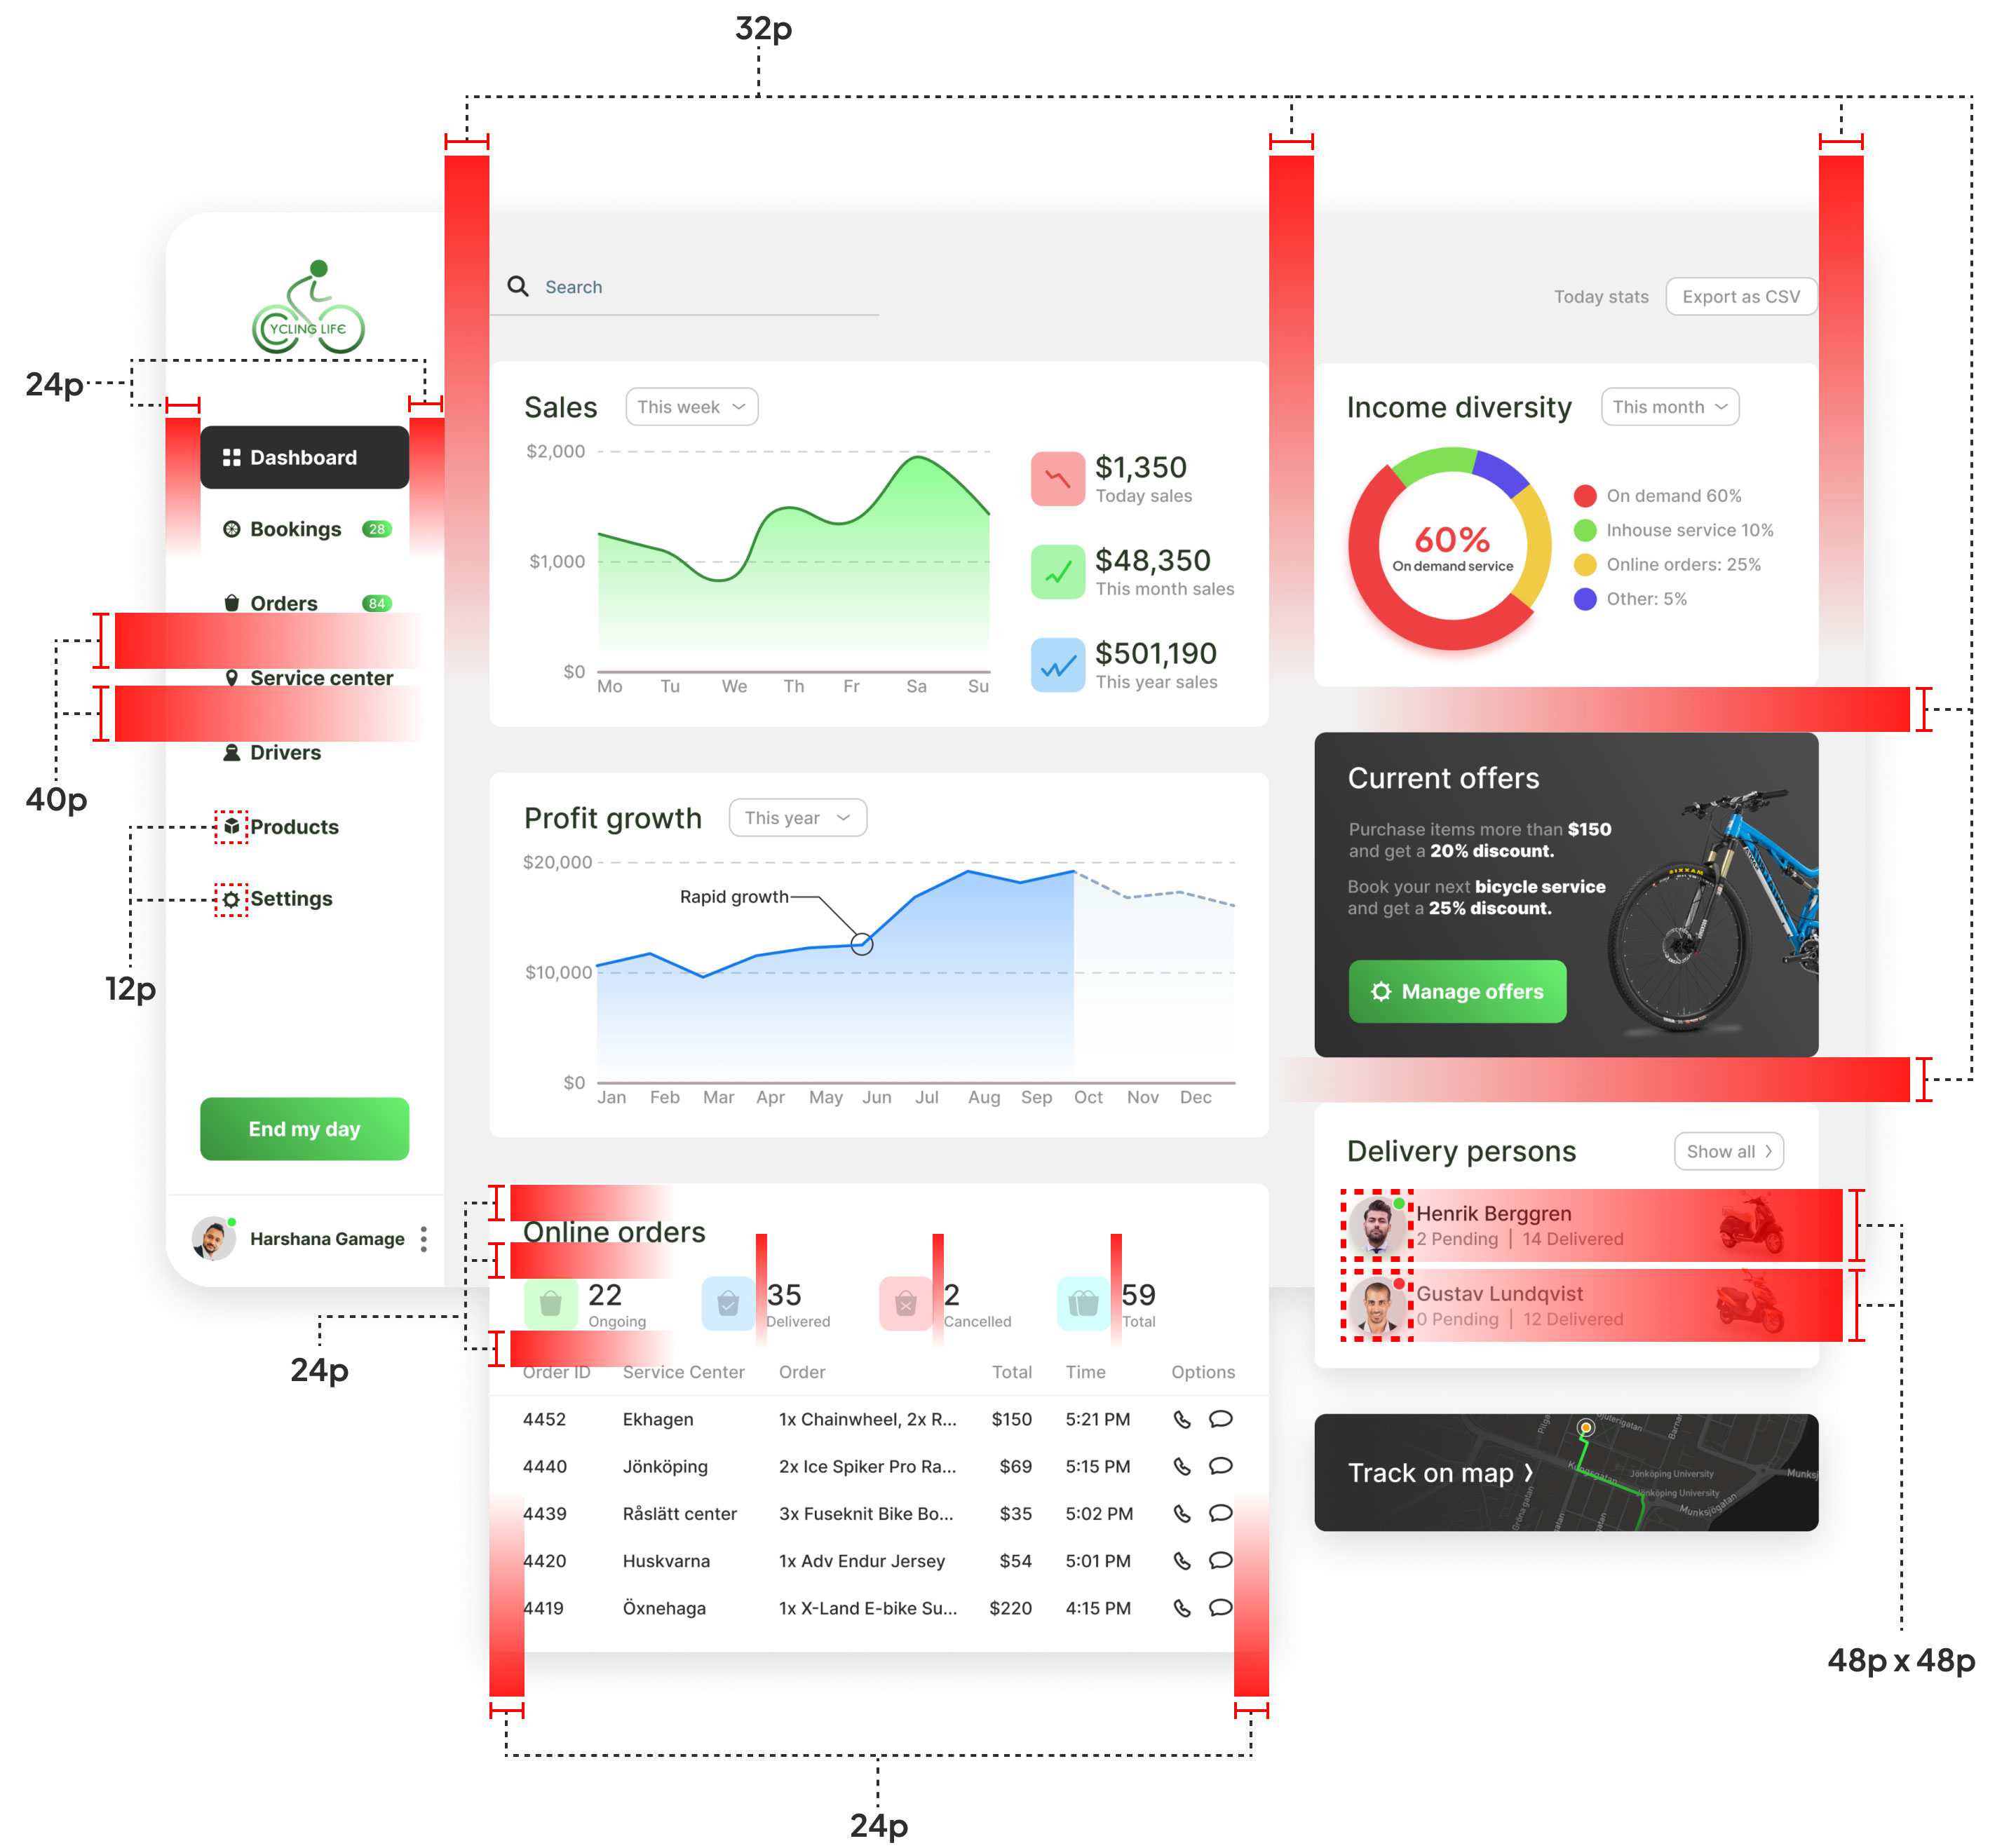
In the online screen, all the online orders are listed according to the date. Important details such as order ID, order status, service center, total, date and time, and the driver are shown in the table. At the top of the screen, a summary of the orders is displayed, including ongoing orders, delivered, cancelled, total, total sales, and this month’s sales from online orders, etc. The admin user can easily contact the driver using the given shortcuts for calls and chat with the driver.

Driver, vehicles, and service provider management screen.

In this screen, the admin user can manage all the delivery drivers, service providers, and vehicles in the business. Here, I have shown the driver tab and how to view the information of a selected driver. It displays details such as the driver’s name, registration number, contact options with the driver, information about the vehicle and its conditions, current delivery status, and the current location on the live map.

Adding a product.

In this screen, the admin user can add products to the system, specifically for the online store. The user can manage these products by updating details, deleting, etc. There are four main categories: Bicycles, Accessories, Clothes, and Special Sale Items. Users can add products under each of these categories.

Service center management screen.

The admin user can manage (add, update, or remove records) all the service centers of their business. On the map on the right side, it shows the location of the service centers. Using the checkbox at the bottom of the map, the user can hide or show currently closed service centers. In addition to that, the admin user can view reports or chat with the service center in this screen.

Chat with drivers screen.

In this screen, the admin user can easily communicate with drivers and service providers of the business. Select the user and initiate a chat. The chat is designed for easy communication, with colors used to make the contents easily readable.

Alignment and grid used for the designing

UI designing is not just dragging and dropping some boxes to create a design. It’s more than just drag and drop. I believe in hierarchy in designs and in clean and simple design, along with the proximity between elements, which adds easiness for the reader to read and interact with the design. Therefore, I have used an 8-point grid for the project to align elements. With this, 8, 16, 24, 32, 48, and 56 (or numbers those are related to the multiplication of 4) have been used accordingly to align elements to their relevant groups.

Live prototype of Cycling Live Web application

Accessibility check of web page contents

To enhance accessibility in the admin panel web application, I assessed it against the AA standards of the Web Content Accessibility Guidelines (WCAG) concerning contrast. Almost all the elements met AA standards, and I subsequently adjusted some elements to ensure compatibility with this standard. To check the accessibility standards I used Contrast Checker of WebAIM.org website (https://webaim.org/resources/contrastchecker/).

The initial contrast check for the “Delete” button in this message box failed. Subsequently, I corrected its contrast to ensure it passed the check.

Cycling Life Mockup designed by Harshana Gamage

SAS admin panel web app summary

In this project, I initiated market research and analyzed the bicycle market and related services in Sweden and the European region. I received valuable practical suggestions and feedback from members of a Facebook group, incorporating their insights into further research. Subsequently, I identified solutions to implement and began creating the product using the framework I had developed. The low-fidelity designs evolved into high-fidelity ones, which I then interconnected. Finally, I conducted an accessibility check and updated the system accordingly.
Cycling Life UI UX design by Harshana Gamage

Have any questions about this project?
I would love to talk more about it with you!

any question you have to ask from Harshana
Scroll to Top